Statistics
Overview
Statistics is the discipline that concerns the collection, organization, analysis, interpretation, and presentation of data. It provides the mathematical framework for understanding uncertainty, making predictions, and drawing conclusions from incomplete information. Whether in science, economics, or engineering, statistical methods are essential for distinguishing signal from noise and extracting meaningful insights from data.
Background and Importance: Statistics is fundamental to science, business, engineering, and policy-making. It enables researchers and practitioners to quantify uncertainty, test hypotheses rigorously, model complex relationships in data, and make evidence-based decisions. The field has roots in probability theory and has evolved to encompass sophisticated computational methods for analyzing everything from large-scale datasets to small, carefully designed experiments.
Two Core Pillars: The field divides into Descriptive Statistics, which summarizes and organizes data to reveal main features (mean, median, variance, distribution shape), and Inferential Statistics, which uses sample data to generalize about populations, make predictions, and test theories. These complementary approaches work together: descriptive statistics summarize what you observe, while inferential statistics help you understand what it means.
Implementation Framework: Statistical analysis in Python is powered primarily by SciPy, NumPy, and Statsmodels. SciPy provides the foundational distributions and statistical tests, NumPy enables efficient numerical computations on arrays, and Statsmodels offers higher-level model fitting and diagnostics. These libraries are built on decades of research and are widely used across academia and industry.
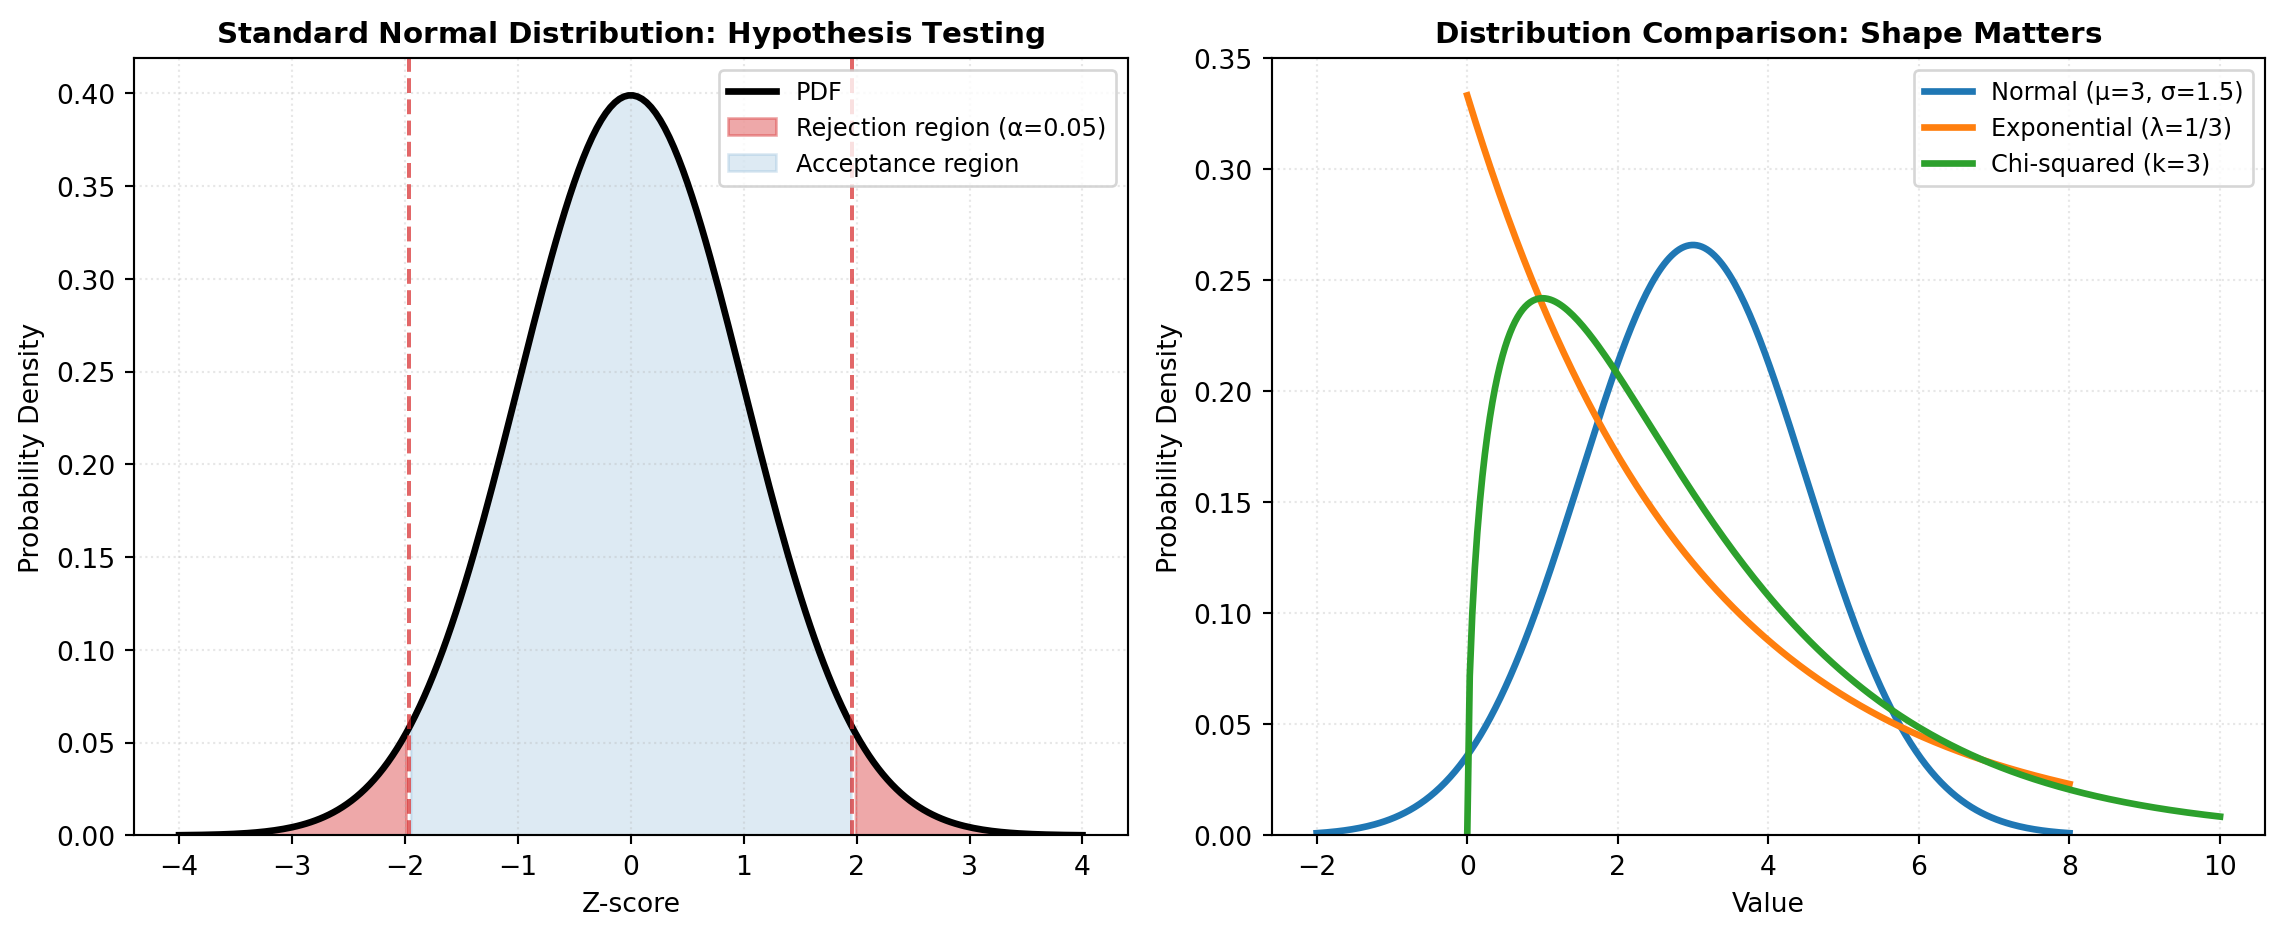
Hypothesis Testing and Inference: One of statistics’ most powerful applications is hypothesis testing—a formal process for assessing whether observed differences or patterns could arise by chance. Tests range from simple comparisons of two groups using t-tests to sophisticated approaches for categorical data (chi-square tests), non-parametric alternatives (Mann-Whitney U test), and specialized tests for association and correlation. Choosing the right test depends on data type, sample size, and assumptions about underlying distributions.
Probability Distributions: The foundation of statistical inference rests on probability distributions. Continuous distributions like the normal (Gaussian) distribution, t-distribution, F-distribution, and exponential distribution model continuous measurements. Discrete distributions like binomial, Poisson, and negative binomial handle count data. Multivariate distributions extend these concepts to multiple variables simultaneously, essential for modeling joint behavior in multivariate datasets. Understanding the properties of these distributions—their shape, tail behavior, and moments—is crucial for selecting appropriate models.
Advanced Statistical Modeling: Beyond basic hypothesis tests, regression models investigate relationships between variables: ordinary least squares (OLS) for linear relationships, quantile regression for conditional quantiles, and robust methods for data with outliers. Generalized Linear Models (GLMs) extend regression to non-normal response variables, handling binary outcomes (logistic regression), counts (Poisson regression), and survival times. Mixed effects models incorporate random variation from multiple sources, essential when data has hierarchical or clustered structure. Survival analysis specialized tools like Kaplan-Meier estimators and Cox proportional hazards models for time-to-event data common in medicine and engineering.
Multivariate and Dimensionality Reduction: When analyzing many variables simultaneously, techniques like Principal Component Analysis (PCA) reduce dimensions while preserving variance, factor analysis uncovers latent structures, canonical correlation analysis (CCA) finds relationships between variable sets, and MANOVA tests differences across multiple outcomes. These methods reveal hidden patterns and simplify interpretation of high-dimensional data.