Probability Distributions
Overview
Probability distributions are fundamental mathematical functions that describe the likelihood of different possible outcomes for a random variable. They form the theoretical foundation of statistics and data science, enabling practitioners to model uncertainty, quantify risk, predict future events, and make informed decisions under incomplete information.
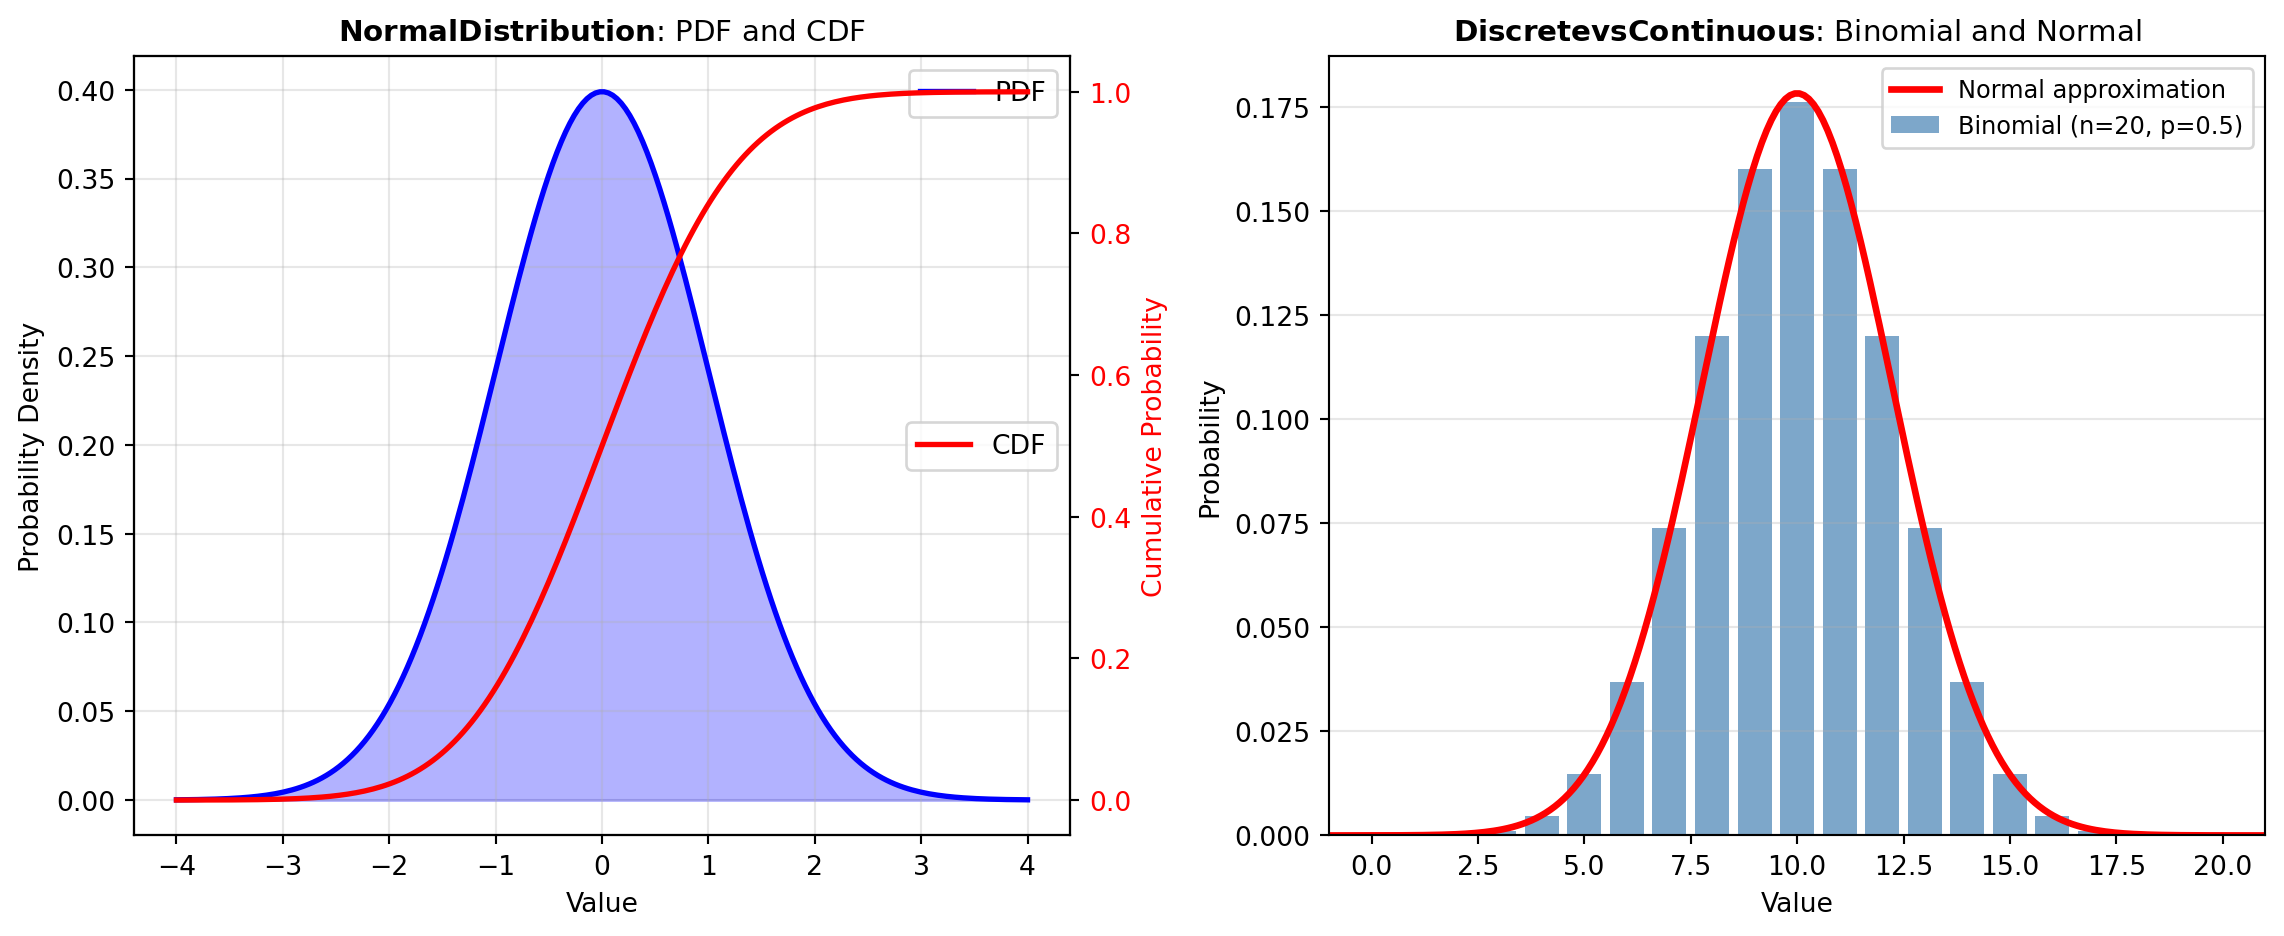
Every probability distribution is defined by its probability density function (PDF) for continuous variables or probability mass function (PMF) for discrete variables, which specifies the relative likelihood of each outcome. Associated with each distribution are its cumulative distribution function (CDF) for calculating probabilities up to a threshold, quantile functions for finding threshold values, and key summary statistics like mean, variance, and skewness that characterize its behavior.
Background and Implementation
This library provides a comprehensive suite of probability distributions built on SciPy, a well-established Python library for scientific computing. SciPy’s statistical module (scipy.stats) contains implementations of dozens of continuous and discrete distributions, along with tools for computing their properties. These tools handle the mathematical complexity behind distribution computations, making it accessible to calculate probabilities, generate random samples, and derive statistics without requiring manual implementation of sophisticated numerical algorithms.
Continuous Distributions
Continuous probability distributions apply to variables that can take any value within a range. The NORM tool provides the normal (Gaussian) distribution, the most widely used distribution in statistics due to the central limit theorem. Other essential continuous distributions include the EXPON distribution for modeling wait times and lifetimes, the CHISQ distribution for hypothesis testing and goodness-of-fit tests, and the T_DIST distribution for inference on small samples. The BETA, LOGNORM, WEIBULL_MIN, and PARETO distributions model phenomena with specific shapes and are useful for modeling skewed or heavy-tailed data. The UNIFORM distribution represents maximum uncertainty within a bounded range, while the LAPLACE distribution is useful for modeling data with a sharp peak around a central value.
Discrete Distributions
Discrete probability distributions describe outcomes that take only integer or countable values. The BINOM distribution models the number of successes in a fixed number of independent trials, while the POISSON_DIST distribution models the count of rare events occurring in a fixed interval. The GEOM distribution describes the number of trials until the first success, and the NBINOM distribution extends this to multiple successes. The BERNOULLI distribution represents a single binary outcome. Specialized distributions like HYPERGEOM model sampling without replacement, ZIPF and ZIPFIAN describe power-law phenomena, and SKELLAM models the difference between two Poisson-distributed variables. These discrete tools are essential for count data analysis and categorical problems.
Multivariate Distributions
When working with multiple correlated random variables, multivariate distributions become essential. The MULTIVARIATE_NORMAL distribution generalizes the normal distribution to multiple dimensions and is fundamental for modeling correlated continuous variables. The MULTINOMIAL distribution extends the binomial distribution to multiple categories, while DIRICHLET provides a distribution over probability distributions themselves. The WISHART distribution models covariance matrices, making it crucial for Bayesian statistics and random matrix theory. Additional tools include MULTIVARIATE_T for robust multivariate inference, and specialized distributions like VONMISES_FISHER for directional data on hyperspheres.
Using the Distribution Tools
Each distribution tool provides a standardized interface to common operations: computing probability densities or masses, evaluating cumulative probabilities, finding quantiles, generating random samples, and calculating summary statistics. Choose a distribution based on your data characteristics—are values continuous or discrete? Is the data bounded or unbounded? Are there multiple correlated variables? The distributions in this library provide tested implementations that handle numerical edge cases and ensure accuracy across different parameter ranges.